Computer Aided Drug Design(CADD)
Computer Aided Drug Design(CADD)
Definition of Computer Aided Drug Design(CADD)
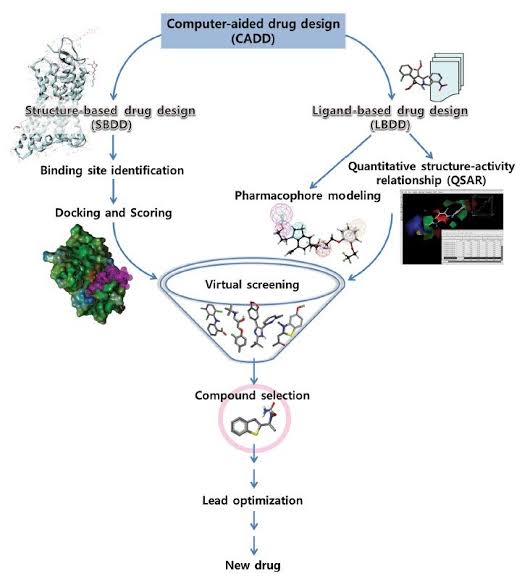
Drug design which relies on computer modeling techniques is referred to as computer-aided drug design. Computer-aided drug design uses computational chemistry to discover, enhance, or study drugs and related biologically active molecules. The most fundamental goal is to predict whether a given molecule will bind to a target and if so how strongly. Overcome the limitations of conventional methods.
Methods employed
Different bioinformatics tools.
Molecular docking
QSAR
Objective of CADD
To change from:
Random screening against disease assays
Natural products, synthetic chemicals
To:
Rational drug design and testing
Speed-up screening process
Efficient screening (focused, target directed)
De novo design (target directed)
Integration of testing into design process
Fail drugs fast (remove hopeless ones as early as possible)
Significance of CADD
Filtration of large compound libraries into smaller compounds sets of predicted activity those could be further tested experimentally.
Gives information about optimization of lead compounds, whether to increase bio affinity and pharmacokinetic properties like absorption, distribution, metabolism, excretion (ADME) as well as toxicity knowledge.
Designing of novel compounds containing one functional group in a chemical compound or new chemo types by joining different fragments
Major types of approaches in CADD
There are mainly two types of approaches for drug design through CADD is the following:
Structure based drug design / direct approach
Ligand based drug design / indirect approach
APPLICATIONS
Use of computing power to streamline drug discovery and development process.
Leverage of chemical and biological information about ligands and /or targets to identify and optimize new drugs
Design of in silico filters to eliminate compounds with undesirable properties.
Role of computer aided molecular modeling in the design of inhibitors of renin.
Department of Pharmaceutical Chemistry
Inhibitors of Dihydrofolate reductase.
Approaches to Antiviral drug design
Conformation biological activity relationships for receptor selective, conformationally constrained opioid peptides.
Design of conforamtionally restricted cyclopeptides for the inhibition of cholate uptake of hepatocytes
COMPUTATIONAL TOOLS USED IN CADD/ SOFTWARE FOR DRUG DESIGN
The software that is available for computer-aided drug design and development originates from different sources. These include commercial companies, academic institutions, open-source software or in-house development. Each of these sources has its pros and cons, and the appropriate choice varies for institutions that use the software. These software packages also differ in terms of cost, functionality and efficacy, and automation.
Categories of software
Databases & Draw Tools
Molecular Modeling & Homology Modeling
Binding site prediction & Docking
Ligand design Screening -QSAR
Binding free energy estimation
ADME Toxicity
AutoDock
Autodock is a suite of automated docking tools. It is designed to predict how small molecules, such as substrates or drug candidates bind to a known 3D structure receptor. It has been modified and improved to add new functionalities, and multiple engines have been developed. Now two major generations are there: AutoDock 4 and AutoDock Vina. AutoDock-GPU is an accelerated version of AutoDock4 that is hundreds of times faster than the original single-CPU docking code. It can also help to guide organic synthetic chemists to design better binders.
Swiss dock
It is an online docking web service that provides services to dock and predict molecular interactions between a biological target molecule and a ligand drug molecule. It consists of a database, namely S3DB, which manually curates target and ligand structures inspired by the Ligand-Protein Database. It can generate a complex to perform subsequent calculations. It works on its own server for docking, giving an accurate docked score compared to others. The time taken for docking may vary. Large molecules cannot be used on this service.
Accelrys Discovery Studio
Accelrys Discovery Studio is a software suite from Biovia for simulating small molecule and macromolecule systems, including silico techniques such as molecular mechanics, free energy calculations, and biotherapeutics developments. It is an apt tool to explore biological and physicochemical processes down to the atomic level. A researcher must optimise both biochemical potency and, at the same time, optimise other characteristics such as ADME and toxicity. It is an advanced tool for protein chemistry and discovering small and large molecule therapeutics from target identification to lead optimisation. It is a key aspect of the analysis and designing of a molecule. It also includes a graphical visualisation tool for viewing, sharing, and analysing protein and modelling data.
PyMOL
PyMOL is a molecular visualisation system on an open-source foundation, maintained and distributed by Schrodinger. It supports all the operating systems like Windows, iOS, and Linux. PyMOL 2.5 is the latest version for this. PyMOL can produce high-quality 3D images of small molecules and biological macromolecules, such as proteins. According to the original author, by 2009, almost a quarter of all published images of 3D protein structures in the scientific literature were made using PyMOL.PyMOL is one of the few mostly open-source model visualization tools available for use in structural biology. The Py part of the software's name refers to the program having been written in the programming language Python.
Chimera
UCSF ChimeraX (or simply ChimeraX) is the next-generation molecular visualisation program from the Resource for Biocomputing, Visualization, and Informatics (RBVI), following UCSF Chimera. UCSF Chimera is a program for the interactive visualisation and analysis of molecular structures and related data, including density maps, trajectories, and sequence alignments. It is available in both free (non-commercial) and commercial forms.
Сhemdrаw
KingDraw is a free chemical drawing editor that allows users to sketch molecules, reactions, and organic chemistry objects and pathways. Users can also use it to analyse compound property, convert chemical structures to IUPAC names and view 3D models. KingDraw will provide strong software support for chemical research, including more chemical-related functions and new structure drawing modes to connect Android & iOS devices and PC, realising rapid transforming from KingDraw to Office, ChemDraw and picture. It has many powerful functions, like AI image identification, intelligent gesture drawing, clean up structure, get 3D model, conversion between name and structure, structural formula searching, chemical property analysis, built-in group and free sharing.
Mаrvin Suite
Marvin suite is a chemically intelligent desktop toolkit that helps draw, edit, publish, render, import and export chemical structures and allows conversion between various chemical and graphical file formats. It is free for individual, academic and non-commercial use. MarvinSketch features extensive functionalities to enable the fast and accurate drawing of chemical compounds, reactions, Markush structures, and query molecules. MarvinView is an advanced chemical viewer for single and multiple 2D/3D chemical structures, queries, reactions, and associated data. It also supports the widest selection of industrially acknowledged standard chemical file formats.
MedСhem Designer
It is a tool that combines innovative molecule drawing features with fast and accurate ADMET property predictions from our top ranked ADMET Predictor. Chemists who design new compounds for pharmaceutical, cosmetic, industrial chemical, herbicide, pesticide, and food applications will enjoy the highly intuitive interface with several convenience features and capabilities not available in other molecule drawing software.
VMD
VMD (Visual Molecular Dynamics) is a molecular visualization program for displaying. animating, and analyzing large biomolecular systems such as proteins, nucleic acids, lipid bilayer assemblies, etc. using 3-D graphics and built-in scripting. VMD supports computersrunning MacOS X, Unix, or Windows, is distributed free of charge, and includes source code. It may be used to view more general molecules, as VMD can read standard Protein Data Bank (PDB) files and display the contained structure. VMD provides a wide variety of methods for rendering and coloring a molecule. VMD can be used to animate and analyze the trajectory of a molecular dynamics (MD) simulation. In particular, VMD can act as a graphical front end for an external MD program by displaying and animating a molecule undergoing simulationon a remote computer.
Key Features of VMD
General 3-D molecular visualization with extensive drawing and coloring methods
Extensive atom selection syntax for choosing subsets of atoms for display
Visualization of dynamic molecular data
Visualization of volumetric data
Supports all major molecular data file formats
No limits on the number of molecules or trajectory frames, except available memory
Molecular analysis commands
Rendering high-resolution, publication-quality molecule images
Movie making capability
Building and preparing systems for molecular dynamics simulations
Interactive molecular dynamics simulations
Extensions to the Tcl/Python scripting languages
Extensible source code written in C and C++
Ligаnd Sсоut
Ligand Scout is software used for creating three-dimensional (3D) pharmacophore models from structural data of macromolecule–ligand complexes. It incorporates the 3D chemical features such as hydrogen bond donors, acceptors, lipophilic areas, positively and negatively ionisable chemical groups that describe the interaction of a bound small organic molecule (ligand) and the surrounding binding site of the macromolecule. These pharmacophores can be overlaid and superimposed using a pattern-matching based alignment algorithm based solely on pharmacophoric feature points instead of chemical structure. The software has successfully predicted new lead structures in drug design.
Others tools
BKСhem
It is a free chemical drawing program. It was conceived and written by Beda Kosata and is currently maintained by Reinis Danne. BKChem is written in Python, an interpreted and excellent programming language, implying some of the program features:
Platform independence – It runs on any platform that Python does.
Performance - as Python is interpreted language, one should not expect the performance of a native code compiled application (in present days, a cheap trade-off for platform independence).
It is developed on GNU/Linux. It was, however, successfully used under Windows XP and MacOS X.
Сhemdооdle
XDrawChem is a two-dimensional molecule drawing program for Unix operating systems. It is similar to other molecule drawing programs such as ChemDraw (TM, CambridgeSoft). It can read and write MDL Molfiles and read ChemDraw text and binary files to allow sharing between XDrawChem and other chemistry applications, and it can create images in popular formats like PNG and EPS. XDrawChem has been tested on Linux, SGI IRIX 6.5, Sun Solaris, Mac OS X, and Windows.
IСM Pro
ICM-Pro helps a biologist or chemist by providing a high-quality protein structure analysis, modelling, and docking desktop software environment. There will be direct access to sequence and structural databases, which allows for all the jobs related to drug design and development. Its key features include Protein Structure Analysis, Pocket Finder, 3D Interactive Editor, Small Molecule Docking, Protein-Protein Docking, Protein Structure Prediction, Predict Effect of Mutation, Bioinformatics Tools, Electrostatics, and molecular graphical tools.
Сhem3D
Chem 3D is a tool to produce colourful three-dimensional chemical structures useful in presentations, posters, and drug designing. It can be used to convert a two-dimensional structure to a three-dimensional structure. It can convert an image in CIF format to a PDB file. It is also useful to visualise, manipulate, calculate bond lengths and angles, perform molecular modelling calculations, and perform molecular dynamics calculations.
Jmol
It is a free and open-source three-dimensional chemical structure writing tool used in drug design. It is cross-platform, running on Windows, iOS, and Linux/Unix systems. The Jmol Viewer is a development tool kit that can be integrated into other Java applications. It supports all major web browsers: Firefox, Safari, Chrome, Opera, and Edge. High-performance 3D rendering with no hardware requirements is the advantage.
PubChem sketcher
It is a network-based tool for molecular sketching which is incorporated with PubChem. It is a web-based information pool for chemical and bioactivity. It is a Web-bas0ed drawing tool for interactive sketching of chemical structures. It is a complete platform for independent and verified work on all major Web browsers, including older ones without support for Web2.0 JavaScript objects.
ChemSketch
ChemSketch is a drawing package that allows drawing chemical structures, including organics, organometallics, polymers, and Markush structures. It also includes calculation of molecular properties like molecular weight, density, molar refractivity, 2D and 3D structure cleaning and viewing, functionality for naming structures (fewer than fifty atoms and three rings), and prediction of logP. The freeware version of ChemSketch does not include all of the functionality of the commercial version. Visit ACD/ChemSketch to learn more about the commercial version.
Activity Miner
The Activity Miner component of Flare™ enables rapid navigation of complex SAR while highlighting key activity changes. Dedicated interfaces enable detailed investigation of activity cliffs and near neighbours to enhance understanding. It can compare selected molecules for changes in electrostatics, shape, protein interactions or clusters using 3D or 2D relationships. Activity Miner explains the reasons behind an activity change. It offers multiple data views to help find key molecule pairs in SAR. For each pair, Activity Miner shows how the electrostatic and shape properties differ, building an understanding of designing better compounds with better properties. The different views enable the user to focus on various aspects of SAR.
Flare
Flare Viewer is a free version of Flare ligand-based and structure-based drug design solution enabling research chemists to discover novel small molecules more efficiently and effectively in a single platform. It is used for the design and Optimisations of ligand binding.
СhemBiоDrаw
ChemDraw, available from CambridgeSoft, has long been the preferred package for drawing chemical structures for publication-quality graphics. It also has been used as the drawing package for database queries and electronic notebooks. The package has developed enhancements such as NMR spectra prediction, TLC plate tools, molecular and physicochemical property calculations, and structure naming. With the latest version (Version 11), perhaps the first surprise is the name change to reflect the increased emphasis on the biological drawing features of BioDraw.
СhemАxоn
It provides several desktop tools such as the drawing tool Marvin and plugins to calculate various physicochemical properties. A tool to calculate pKa and the resulting LogD, the essential physicochemical property in medicinal chemistry. There are command-line versions of these calculations that are invaluable for dealing with huge datasets, and these were used in a script to analyse fragment collections.
FоrgeV10
ForgeV10 allows the scientist to use Cresset’s proprietary electrostatic and physicochemical fields to align, score and compare diverse molecules. It allows the user to build field-based pharmacophores to understand structure-activity and then use the template to undertake a virtual screen to identify novel scaffolds.
Vortex
Vortex is a chemically aware data analysis and spreadsheet tool from Dotmatics. It can import files from a SQL database and do substructure or structural similarity searches. Calculate many physicochemical properties and perform data analysis and display. It is an interactive data visualisation and analysis solution for scientific decision support. Building on and extending the spreadsheet paradigm, it provides the data manipulation, statistical analysis and sophisticated plotting capabilities required to explore and understand any complexity and size of data. Vortex is also scientifically aware, providing native cheminformatics and bioinformatics analysis and visualisations.
Mоlinsрirаtiоn
Molinspiration offers a broad range of cheminformatics server tools supporting molecule manipulation and processing, including SMILES and SD file conversion, normalisation of molecules, generation of tautomer’s, molecule fragmentation, calculation of various molecular properties needed in QSAR, molecular modelling and drug design, high-quality molecule depiction, molecular database tools supporting substructure and similarity searches. Our products also support fragment-based virtual screening, bioactivity prediction and data visualisation. Molinspiration tools are written in Java and can be used on any computer platform.
Ассоrd for Excel
Accord for Excel is a valuable tool used by all the synthetic chemists at Biovitrum. We first acquired Accord with the combinatorial chemistry add-in to provide an easy-to-use method for chemists (both medicinal and combinatorial) to enumerate libraries and combine structural and analytical data, often exported from instruments in Excel format. It provides us with a convenient method of moving chemical structures and data between systems and performing simple calculations on those structures.
SeeSAR
It is a virtual drug design platform. Quick and informative calculations can be used to dock, design, and analyse a new chemical entity in a flash. It evaluates ligand-target interactions by intuitive colour codes and gorgeous visualisation. Drag and Drop facilities for both ligands and targets are available. If we choose the structure-based drug design, there may be facilities to edit the target protein virtually. The most exciting part of the platform is its Inspirator mode which gives new ideas to discover new scaffolds, explore and grow into free cavities, or link molecules using fragment libraries for elegant solutions.
Autodock Vina
Autodock is one of the docking engines of the AutoDock Suite, an open-source program for molecular docking. It is more accurate than Autodock. It is more compatible and easier to use.
InfiniSee
InfiniSee is a virtual screening platform. It finds molecules of interest in chemical spaces of (almost) infinite size based on similarity. Given a template or query molecule, infiniSee returns similar molecules from these chemical spaces or screening libraries.
Zdосk
Zdock performs a full rigid-body search of docking orientations between two proteins. The current version, 3.0.2, includes performance optimisation and a novel pairwise statistical energy potential. M-ZDOCK: A modification of ZDOCK to predict symmetric assemblies using a subunit structure. ZRANK: A docking refinement program developed to provide fast and accurate rescoring of models from initial-stage docking (e.g., from ZDOCK), as well as refined docking models (e.g., from Rosetta Dock). ZDOCK Server: a protein docking server permitting users to run the latest versions of ZDOCK.
GОLD
It is the validated, configurable protein-ligand docking software for expert drug discovery from virtual screening to lead optimisation. The extensively validated scoring functions in GOLD can be trusted. It has the features of pose prediction, multiple scoring functions, flexible docking, virtual screening, water handling and covalent docking.
Glide
Glide offers the full range of speed vs accuracy options, from high-throughput virtual screening mode for efficiently enriching million compound libraries to the standard precision mode for reliably docking tens to hundreds of thousands of ligands with high accuracy, to the XP (extra precision) mode where further elimination of false positives is accomplished by more extensive sampling and advanced scoring, resulting in even higher enrichment.
FlexAID
It is a molecular docking software that can use small molecules and peptides as ligands and proteins and nucleic acids as docking targets. As the name suggests, FlexAID supports complete ligand flexibility and side-chain flexibility of the target. It does use a soft scoring function based on the complementarity of the two surfaces.
GEMDOCK
The generic evolutionary method of docking is named GEMDOCK. It is a program for computing a ligand conformation and orientation relative to the target protein’s active site. It may run as either a purely flexible or hybrid docking approach. It automatically generates all docking variables, such as atom formal charge, atom type, and the ligand-binding site of a protein. It is now accompanied by many add-on programmes, making it truly convenient and less time-consuming.
MS-Dосk
MS-DOCK is an efficient multiple conformation rigid-body docking approach based on DOCK. It can be easily used for the generation of multi-conformer libraries and for shape-based filtering within a multi-step structure-based screening protocol to shorten computation time.
Ligand Fit
Ligand Fit is a shape-based method for accurately docking the ligands into a protein’s active binding site. The method employs a cavity detection algorithm for detecting invaginations in the protein as candidate active site regions. Candidate poses are minimised in the context of the active site using a grid-based method for evaluating protein-ligand interaction energies.
UСSF Dосk
UCSF dock is another docking software in which DOCK6 is the latest version written in C++ and is functionally separated into independent components allowing a high degree of flexibility. It needs about 100 MB of disk space. The new features added include additional scoring options for energy minimisation, Delphi electrostatics, ligand conformational entropy corrections, ligand desolvation, receptor desolvation, receptor flexibility, conjugate grading minimization.
GalaxyPepDock
GalaxyPepDock is a web server-based protein-protein docking interface. It performs similarity-based docking by finding templates from the database of experimentally determined structures and building models using energy-based optimisation that allows for structural flexibility.
Stаrdrор
It is one of the best in-silico technological tools used in Cheminformatics, model building and analysis of chemical entities in drug design and development. It brings about the latest data of drug molecules and targets, which is extremely helpful in predicting biological activity and molecular modelling. It is the best tool to rely on for decision-making while researching drug design. Both the free version and commercial versions are available for this.
rDock
rDock is a fast and versatile open-source program for docking ligands to proteins and nucleic acids, primarily designed for high-throughput virtual screening and prediction of binding mode.
Wаy2Drug
Way2Drug portal has been developed and supported by the multidisciplinary team of researchers working in bioinformatics, cheminformatics, and computer-aided drug discovery for about thirty years. It provides a local correspondence concept, according to which biological activity of drugs-like organic compounds are based on the molecular recognition between the particular atoms of the ligand and the target. Using this concept, we have developed a consistent system of atom-centred neighbourhoods of atoms descriptors, including MNA (Filimonov et al., 1999), QNA (Filimonov et al., 2009), and LMNA (Rudik et al., 2014), and have implemented them in several SAR/QSAR/QSPR modelling approaches.
РАSS
The concept of the biological activity spectrum was introduced to describe the properties of biologically active substances. The PASS (prediction of activity spectra for substances) software product, which predicts more than three hundred pharmacological effects and biochemical mechanisms based on the structural formula of a substance, maybe efficiently be used to find new targets (mechanisms) for some ligands and, conversely, to reveal new ligands for some biological targets. We have developed a WWW interface for the PASS software. A WWW server for the online prediction of the biological activity spectra of substances has been constructed.
GUSAR
GUSAR software was developed to create QSAR/QSPR models based on the appropriate training sets represented as SD files containing data about chemical structures and endpoint in quantitative terms. GUSAR has been developed according to OECD (Organisation for Economic. Co-operation and Development) principles and includes the last achievements in QSAR modelling: consensus prediction, applicability domain assessment, internal and external models’ validation, and precise interpretations of obtaining results.
BRENDA
It is the most comprehensive information repository on enzymes and enzyme ligand data. The BRENDA enzyme information system has developed into an elaborate system of enzyme and enzyme-ligand information obtained from various sources, combined with flexible query systems and evaluation tools.
Pharma Expert Software
PharmaExpert determines the existing relationships between pharmacological effects and biochemical mechanisms. The current version of PharmaExpert covers 1587 mechanisms of action, 418 pharmaco-therapeutical effects and 2664 types of relationships between them. Each biologically active compound reveals various biological actions in biological systems (human organisms, animals, in vivo and in vitro assays). It is impossible to study each compound in all tests currently available. Therefore, the ability to select compounds with required types of biological activity and without unwanted adverse effects and toxicity is very desirable.
Chemical Checker
It is a resource of chemical and biological small molecule similarities. Molecules are compared from multiple viewpoints
relevant to the drug discovery pipeline, from the chemical properties to the clinical outcomes.
Toxtree
Toxtree is a fully featured and flexible, user-friendly open-source application that can estimate toxic hazards using a decision tree approach. Toxtree could be applied to datasets from various compatible file types. User-defined molecular structures are also supported – they could be entered by SMILES or the built-in 2D structure diagram editor.
Merits of CADD
DRUG DISCOVERY: Use of computing power to streamline drug discovery and development process.
Elimination of compounds with undesirable properties: Design of in silico filters to eliminate compounds with undesirable properties (poor activity and/or poor Absorption. Distribution, Metabolism, Excretion and Toxicity, ADMET) and select the most promising candidates.
Identify and optimize new drugs: Leverage of chemical and biological information about ligands and/or targets to identify and optimize new drugs.
TIME SAVING: The process of drug discovery and development is a long and difficult one, and the costs of developing are increasing rapidly. Today it takes appropriately 10years and $100million to bring a new drug to market.
REDUCED COST: The use of new computer-based drug design techniques has the ability to accomplish both of these goals and to improve the efficiency of the process as well, thus reducing costs.
IMPROVE QUALITY OF LIFE: The emphasis now is not just on finding new ways to treat human disease, but also on improving the quality of life of people in general.
Time to market: By focussing drug research on specific lead candidates companies can market the drugs quickly.
Demerits of CADD
Lack of Synergistic Computational Model: Synergy is the combined power of a group of things when they are working together that is greater than the total power achieved by each working desperately. Synergy manifests itself quantitatively or qualitatively: synergistic effects can be smaller or larger or they can be entirely different from what was expected. There is no single mathematical model that can be used uniformly to detect and quantify synergy. Traditionally, two independent parameters: the target similarity score (TSS) and the protein interaction score (PIS) are used for quantitatively measure the degree functional association between the target and ligand.
Lack of Quality Database: Drug discovery not only needs the reliable models, but also reliable data. The ModBase, PMP, and SWISS-MODEL are the three common databases are often used for drug discovery. The Protein Data Bank (PDB) (2013), established in 1971 at the Brookhaven National Laboratory, and the Cambridge Crystallographic Data Center, are among the most commonly used data bases for protein structure. These databases are good for concept validation, prototype development and small academic research and experiments but they are far away from the requirements of exhaustive drug analysis and discovery in real life situations.
Lack of Standardization for Testing and Validating the Results: Today, a basic concept is accepted that a model should be tested with an independent test set. An independent test dataset means a set that was never used in the model developing procedure. Before the start of the modeling development a test set is excluded from the compiled data set. Again, different strategies are possible. Usually, a random selection is performed, or, alternatively, the objects for the test set are selected equivocally from the entire model's domain.
Lack of Accurate Scoring Function: Scoring functions are mathematical functions used to approximately predict the binding affinity between two molecules after they have been docked. In this process, a large number of binding poses are evaluated and ranked using a scoring function. The scoring function is a mathematical predictive model that produces a score that represents the binding free energy, and hence the stability, of the resulting complex molecule. Scoring functions (SFs) are typically employed to predict the binding conformation, binding affinity, and binary activity level of ligands against a critical protein target in a disease's pathway. NNScore, RFscore, and SFCscore are commonly used scoring functions. However, previous comparative studies have revealed that a universally accurate scoring function is still out of reach.
Challenges with Model Interpretation: Identification of the target protein and the active site with an ideal ligand is not sufficient to reach any logical end in a drug discovery process. There are many obstructions, which come in the way of designing a new drug compound to a final drug molecule.
Issues with Multi-domain Proteins: Proteins are frequently composed of multiple domains. Determining the structure of multi-domain complexes at atomic resolution is critical to understanding the underpinnings of much of biology. However, important challenges still remain in multi-domain docking prediction.
Lack of Procedures for Multi- Drug Effect Assessment: The rise of multi-drug resistant and extensively drug resistant bacteria around the world, poses a great threat to human health and defines a need to develop new, effective and inexpensive anti-bacteria agents. The mystery of chemicals and of chemistry is how structure or substructures are related with chemical behavior and activity.
Quantitative Structure–Activity Relationships (QSAR)
Definition of Quantitative Structure–Activity Relationships (QSAR)
A quantitative structure-activity relationship (QSAR) is a mathematical relationship which correlates measurable or calculable molecular properties to some specific biological activity in terms of an equation. QSAR attempts to find consistent relationship between biological activity and molecular properties, so that these "rules" can be used to evaluate the activity of new compounds. QSAR is an attempt to remove the element of luck from drug design by establishing a mathematical relationship in the form of an equation between biological activity and measurable physicochemical parameters. QSAR is mathematical relationship between a biological activity of a molecular system and its geometric and chemical characteristics. QSAR(Quantitative Structure Activity Relationship) are based on the assumption that the structure of molecule (i.e. its geometric, steric and electronic properties) must contain the features responsible for its physical, chemical and biological properties. QSAR in simplest terms, is a method for building computational or mathematical models which attempts to find a statistically significant correlation between structure and function.
Development of QSAR
QSAR modeling was founded by Corwin Hansch.
Tools for modeling of physical and biological properties of chemicals.
QSAR models find broad applications for assessing the potential impacts of chemicals, nanomaterials on human health and ecological systems.
Achieved by developing QSAR models and employed them for virtual screening followed by experimental validation.
History of QSAR
1900 H. H. Meyer and C. E. Overton: Lipoid theory of narcosis
1930: L. Hammett: Electronic sigma constants
1964: C. Hansch and T. Fujita: QSAR
1984: P. Andrews: Affinity contributions of functional groups
1985: P. Goodford: GRID (hot spots at protein surface)
1988: R. Cramer: 3D QSAR
1992: H. J. Böhm: LUDI interaction sites, docking, scoring
1997: C. Lipinski: Bioavailability rule of five
STEPS IN QSAR
Structure Entry and Modelling
Construction of Model
Descriptor Generation
Model Validation
QSAR and Drug Design
To modify the chemical structure of the lead compound to retain or to reinforce the desirable pharmacologic effect while minimizing unwanted pharmacological and physical and chemical properties, which may result in a superior therapeutic agent;
To use target analogs as pharmacological probes to gain better insight into the pharmacology of the lead molecule and perhaps to reveal new knowledge of basic biology.
Types of QSAR
Fragment based (group contribution)
3-D QSAR
Chemical descriptor based
String based
Graph based
Different models in QSAR
1.Free Energy Relationships
Hansch method: Linear Free Energy Relationships (physicochemical properties)
Martin & Kubinyi : Non Linear Free Energy Relationships (physicochemical properties)
Free Wilson mathematical model (structural elements)
2.Molecular Modeling
3.Quantum Mechanical Model
4.Topological Method
5.Pattern Recognization
2D-QSAR
It is powerful tool for explaining the relationship between chemical structure and experimental observation.
The numerical descriptors used to translate a chemical structure into mathematical.
2D QSAR models are used routinely during the process of optimization of a chemical series towards a candidate for clinical trials.
It can be classified based on parameters and description as:
1)2D vs 3D and Classical vs Non Classical 2)QSAR-QSPR-QSMR-QSTR
3)2D QSAR for drug design
3D-QSAR
In 3D QSAR,3D properties of a molecule are considered as whole rather than consideration individual substituents.
3D-QSAR involve the analysis of the quantitative relationship between the biological activity of a set of compound and their three-dimensional properties using statistical correlation methods.
3D QSAR revolve around the important features of a molecule, its overall size and shape,and its electronic properties.
3D QSAR is an extension of classical QSAR which exploits the 3 dimensional properties of the the ligands to predict their biological activity using robust stastical analysis like PLS.
3D-QSAR uses probe-based sampling within a molecular lattices to determine three-dimentional properties of molecules and can then correlate these 3D descriptors with biological activity.
No QSAR model can replace the experimental technique are also free from errors.
Some of the major factors like desolvation energetics, temperature, diffusion, transport,pH,salt concentration etc.which contribute to all overall free energy of binding are difficult to handle,and thus usually ignored.
Regardless of all such problems, QSAR become a useful alternative approach.
OBJECTIVES of QSAR
QSAR makes it easy now to reach the conclusion for any of the congener that still not in process, in way that whether it will optimal and profitable or not.
To predict the biological activities of untested and sometimes yet unavailable compounds.
To optimize the existing leads so as to improve their biological activities.
ADVANTAGES OF QSAR
Quantifying the relationship between structure and activity provides an understanding of the effect of structure on activity.
It is also possible to make predictions leading to synthesis of novel analogues.
The results can be used to help understand interaction between functional groups in the molecules of greatest activity with those of their target
DISADVANTAGE OF QSAR
False correlation may arise because biological data that are subject to considerable experimental error.
If training dataset is not large enough, the data collected reflect the complete property space. may not reflect the consequently, many QSAR results cannot be used to confidently predict the most likely compounds of best activity.
There are many successful applications but do not expect QSAR works all time. Also be aware of overfiting problem.
Physicochemical Properties of QSAR
Many physical, structural, and chemical properties have been studied by the QSAR approach, but the most com-mon are hydrophobic, electronic, and steric properties. This is because it is possible to quantify these effects. Hydrophobic properties can be easily quantifi ed for complete molecules or for individual substituents. However, it is more difficult to quantify electronic and steric properties for complete molecules, and this is only really feasible for individual substituents.
Hydrophobicity
The hydrophobic character of a drug is crucial to how easily it crosses cell membranes and may also be important in receptor interactions. Changing substituents on a drug may well have signifi cant effects on its hydrophobic character and, hence, its biological activity. Therefore, it is important to have a means of predicting this quantitatively.
The partition coefficient (P)
The hydrophobic character of a drug can be measured experimentally by testing the drug’s relative distribution in an n-octanol/water mixture. Hydrophobic molecules will prefer to dissolve in the n-octanol layer of this two-phase system, whereas hydrophilic molecules will prefer the aqueous layer. The relative distribution is known as the partition coefficient (P) and is obtained from the following equation:
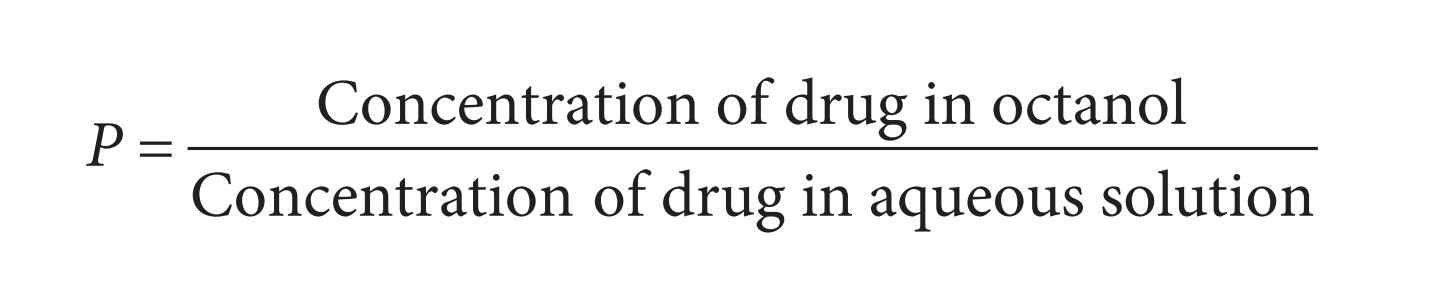
Hydrophobic compounds have a high P value, whereas hydrophilic compounds have a low P value. Varying substituents on the lead compound will produce a series of analogues having different hydrophobicities and, therefore, different P values. By plotting these P values against the biological activity of these drugs, it is possible to see if there is any relationship between the two properties. The biological activity is normally expressed as 1/C , where C is the concentration of drug required to achieve a defined level of biological activity. The reciprocal of the concentration (1/C) is used, as more active drugs will achieve a defi ned biological activity at lower concentration. The graph is drawn by plotting log (1/C) versus logP.
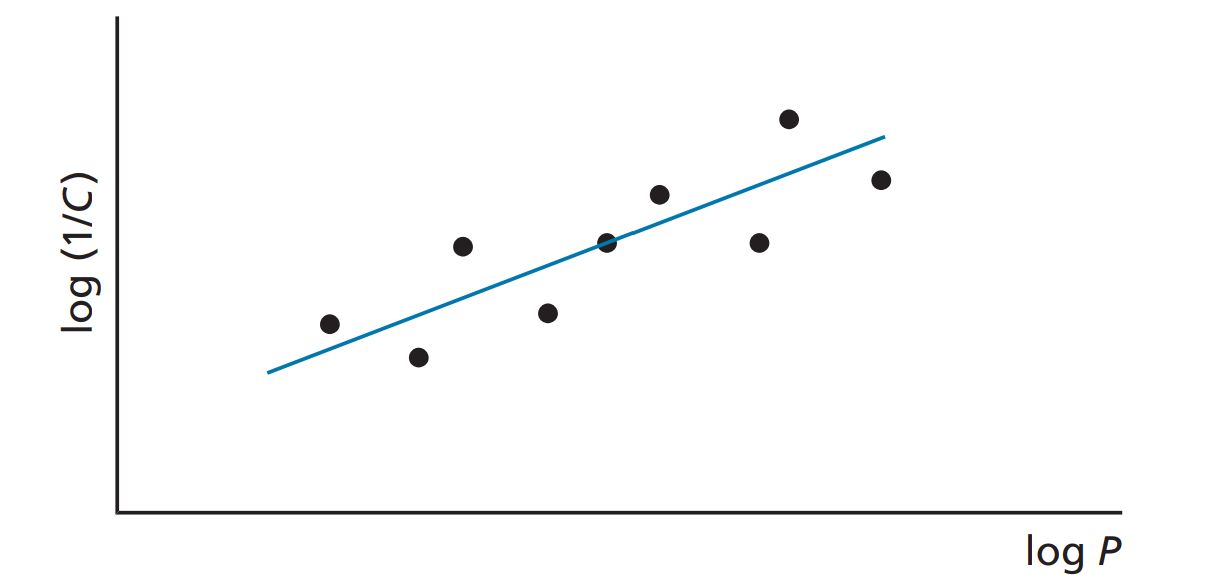
In studies where the range of the log P values is restricted to a small range (e.g. log P = 1–4), a straight-line graph is obtained showing that there is a relationship between hydrophobicity and biological activity. Such a line would have the following equation:

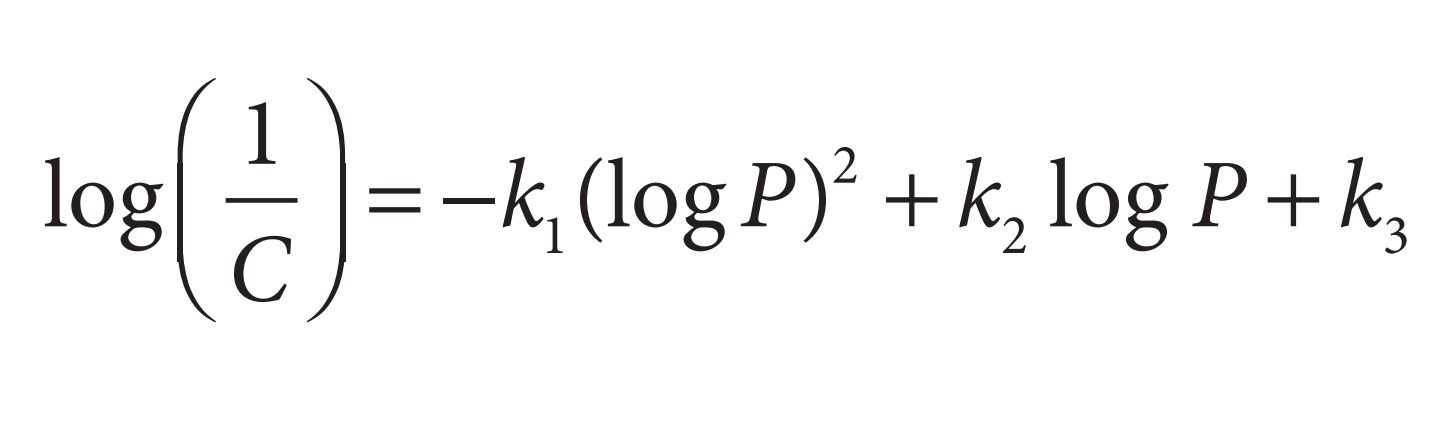
A straight-line relationship between log P and biological activity is observed in many QSAR studies because the range of log P values studied is often relatively narrow. For example, the study carried out on serum albumin binding was restricted to compounds having log P values in the range 0.78–3.82. If these studies were to be extended to include compounds with very high log P values, then we would see a diff erent picture. The graph would be parabolic, as shown in Figure.
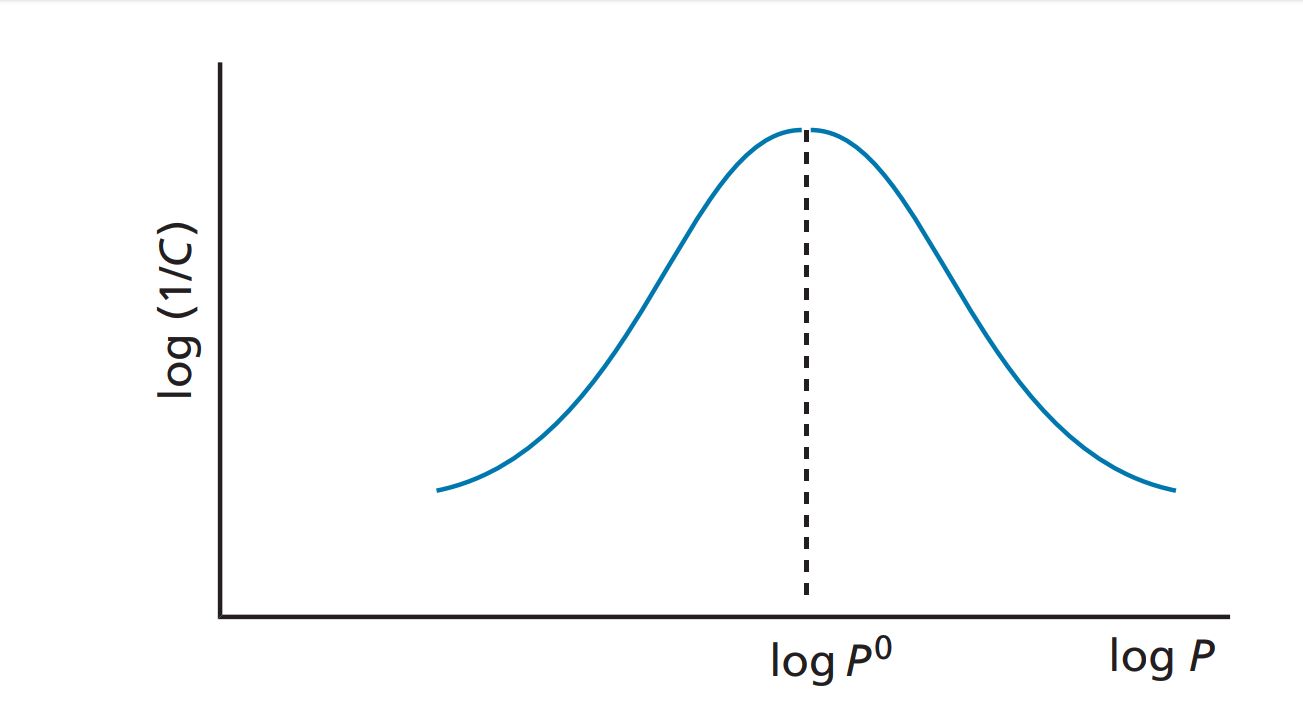
If the partition coefficient is the only factor influencing biological activity, the parabolic curve can be expressed by the equation:
The substituent hydrophobicity constant (π)
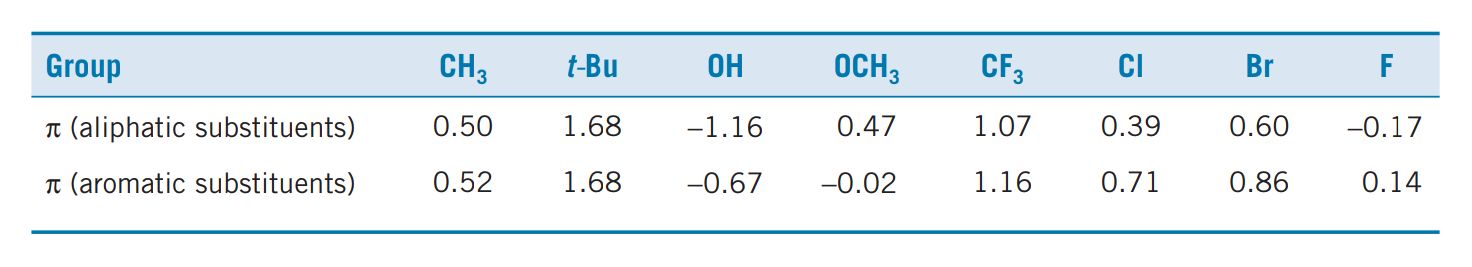
We have seen how the hydrophobicity of a compound can be quantifi ed using the partition coeffi cient P . In order to get P, we have to measure it experimentally and that means that we have to synthesize the compounds. It would be much better if we could calculate P theoretically and decide in advance whether the compound is worth synthesizing. QSAR would then allow us to target the most promising looking structures. For example, if we were planning to synthesize a range of barbiturate structures, we could calculate log P values for them all and concentrate on the structures which had log P values closest to the optimum log P0 value for barbiturates. Partition coefficients can be calculated by knowing the contribution that various substituents make to hydrophobicity. This contribution is known as the substituent hydrophobicity constant (π) and is a measure of how hydrophobic a substituent is relative to hydrogen. The value can be obtained as follows. Partition coeffi cients are measured experimentally for a standard compound, such as benzene, with and without a substituent (X). The hydrophobicity constant (πx ) for the substituent (X) is then obtained using the following equation:

where PH is the partition coeffi cient for the standard compound and PX is the partition coeffi cient for the standard compound with the substituent. A positive value of π indicates that the substituent is more hydrophobic than hydrogen; a negative value indicates that the substituent is less hydrophobic. The π values for a range of substituents are shown in Table.
Electronic effects
The electronic effects of various substituents will clearly have an effect on a drug's ionization or polarity. This, in turn, may have an effect on how easily a drug can pass through cell membranes or how strongly it can interact with a binding site. It is, therefore, useful to measure the electronic effect of a substituent. As far as substituents on an aromatic ring are concerned, the measure used is known as the Hammett substituent constant (σ). This is a measure of the electron-withdrawing or electron-donating ability of a substituent, and has been determined by measuring the dissociation of a series of substituted benzoic acids compared with the dissociation of benzoic acid itself. Benzoic acid is a weak acid and only partially ionizes in water.
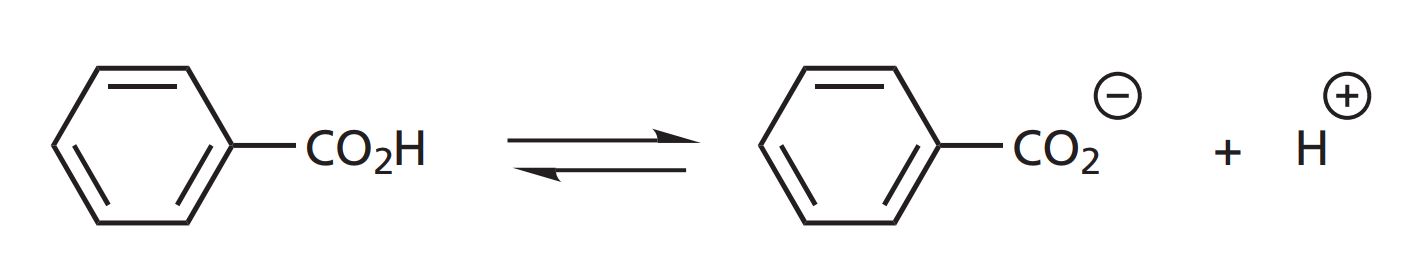
An equilibrium is set up between the ionized and non-ionized forms, where the relative proportion of these species is known as the equilibrium or dissociation constant KH (the subscript H signifies that there are no substituents on the aromatic ring).

When a substituent is present on the aromatic ring, this equilibrium is affected. Electron-withdrawing groups, such as a nitro group, result in the aromatic ring having a stronger electron-withdrawing and stabilizing influence on the carboxylate anion, and so the equilibrium will shift more to the ionized form. Therefore, the substituted benzoic acid is a stronger acid and has a larger KX value (X represents the substituent on the aromatic ring).

If the substituent X is an electron-donating group such as an alkyl group, then the aromatic ring is less able to stabilize the carboxylate ion. The equilibrium shifts to the left indicating a weaker acid with a smaller KX value. The Hammett substituent constant (σX ) for a particular substituent (X) is defi ned by the following equation:
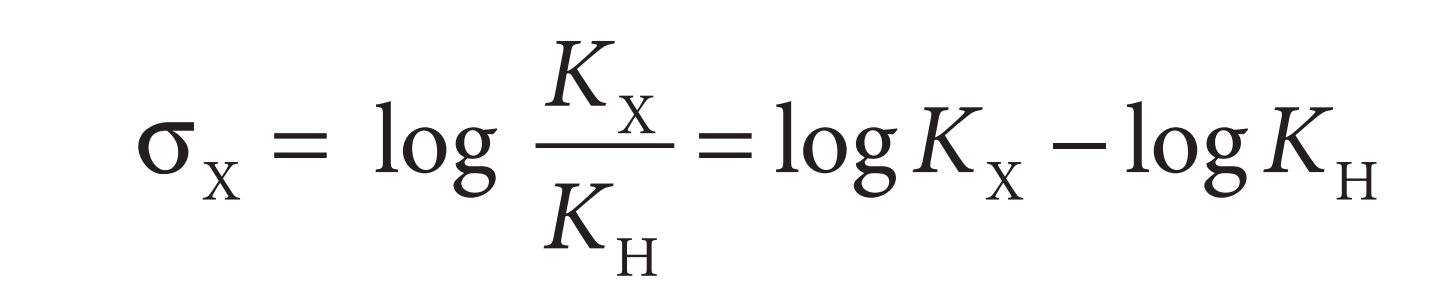
Benzoic acids containing electron-withdrawing substituents will have larger values than benzoic acid itself (KH) and, therefore, the value of σX for an electron-withdrawing substituent will be positive. Substituents such as Cl, CN, or CF3 have positive σ values. Benzoic acids containing electron-donating substituents will have smaller KX values than benzoic acid itself and, hence, the value of σX for an electron-donating substituent will be negative. Substituents such as Me, Et, and t-Bu have negative values of σ. The Hammett substituent constant for H is zero. The Hammett substituent constant takes into account both resonance and inductive effects. Therefore, the value of σ for a particular substituent will depend on whether the substituent is meta or para . Th is is indicated by the subscript m or p after the σ symbol. For example, the nitro substituent has σp = 0.78 and σm = 0.71. In the meta position, the electron-withdrawing power is due to the inductive infl uence of the substituent, whereas at the para position inductive and resonance both play a part and so the σp value is greater.
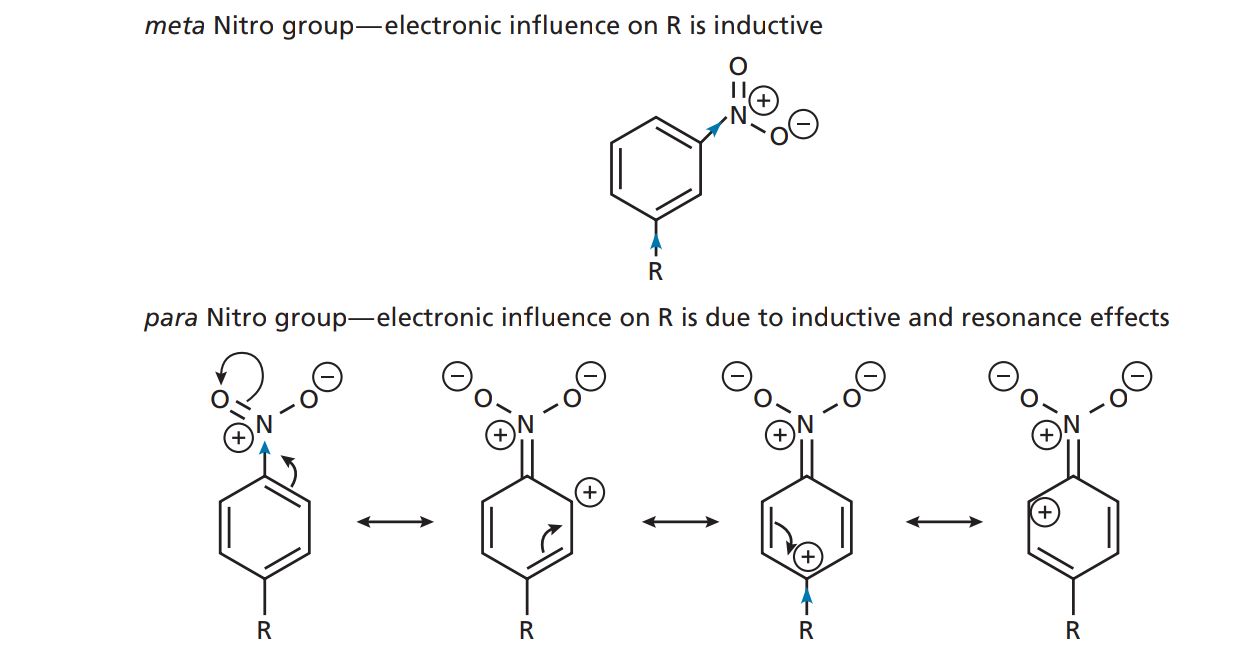
For the hydroxyl group σm = 0.12 and σp = −0.37. At the meta position, the infl uence is inductive and electron-withdrawing. At the para position, the electron-donating infl uence due to resonance is more significant than the electron-withdrawing infl uence due to induction.

Most QSAR studies start off by considering σ, and if there is more than one substituent the σ values can be summed (Σσ).
Steric factors
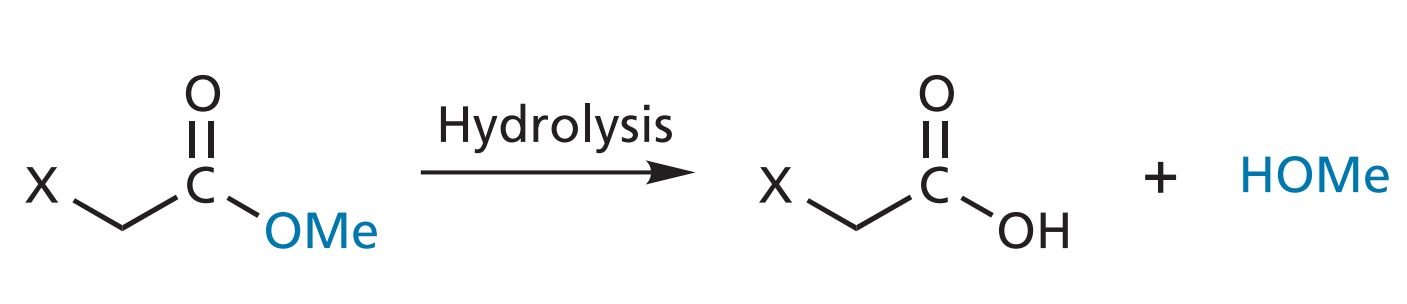
The bulk, size, and shape of a drug will infl uence how easily it can approach and interact with a binding site. Figure: Hydrolysis of an aliphatic ester.
A bulky substituent may act like a shield and hinder the ideal interaction between a drug and its binding site. Alternatively, a bulky substituent may help to orientate a drug properly for maximum binding and increase activity. Steric properties are more diffi cult to quantify than hydrophobic or electronic properties. Several methods have been tried, of which three are described here. It is highly unlikely that a drug’s biological activity will be affected by steric factors alone, but these factors are frequently found in Hansch equations.
Taft’s steric factor ( Es )
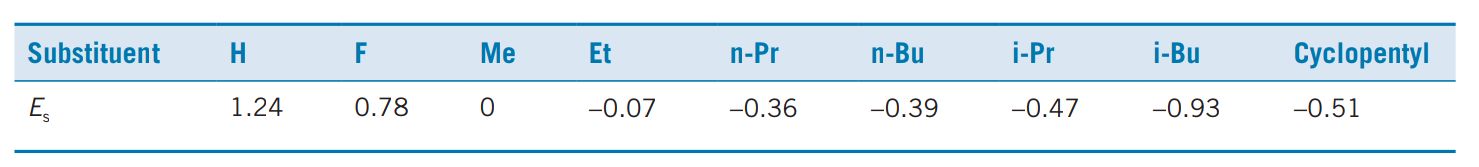
Attempts have been made to quantify the steric features of substituents by using Taft’s steric factor ( Es ). The value for Es can be obtained by comparing the rates of hydrolysis of substituted aliphatic esters against a standard ester under acidic conditions. Thus,
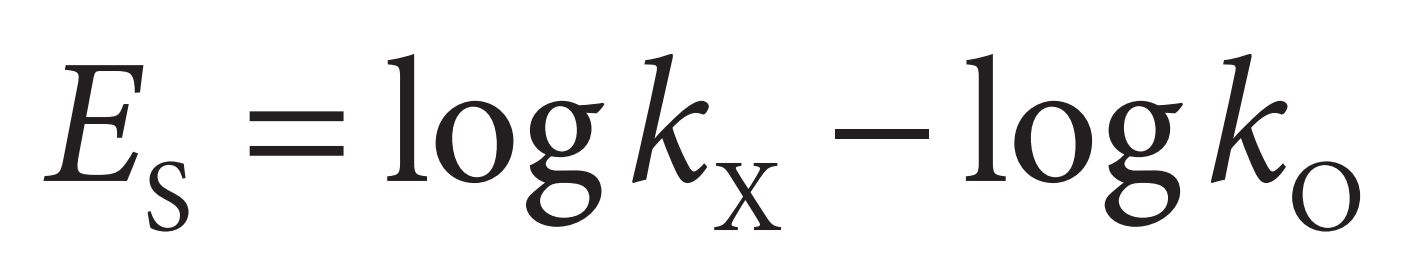
where kx represents the rate of hydrolysis of an aliphatic ester bearing the substituent X and k0 represents the rate of hydrolysis of the reference ester. The substituents that can be studied by this method are restricted to those which interact sterically with the tetrahedral transition state of the reaction and not by resonance or internal hydrogen bonding. For example, unsaturated substituents which are conjugated to the ester cannot be measured by this procedure. Examples of Es values are shown in Table.
Molar refractivity
Another measure of the steric factor is provided by a parameter known as molar refractivity ( MR ). This is a measure of the volume occupied by an atom or a group of atoms. The MR is obtained from the following equation:
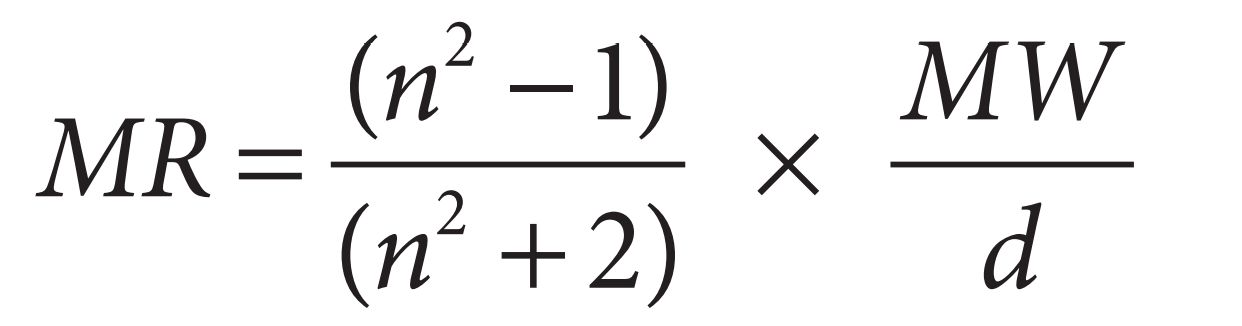
where n is the index of refraction, MW is the molecular weight, and d is the density. The term MW/d defi nes a volume and the ( n2 − 1)/( n2 + 2) term provides a correction factor by defi ning how easily the substituent can be polarized. This is particularly signifi cant if the substituent has π electrons or lone pairs of electrons.
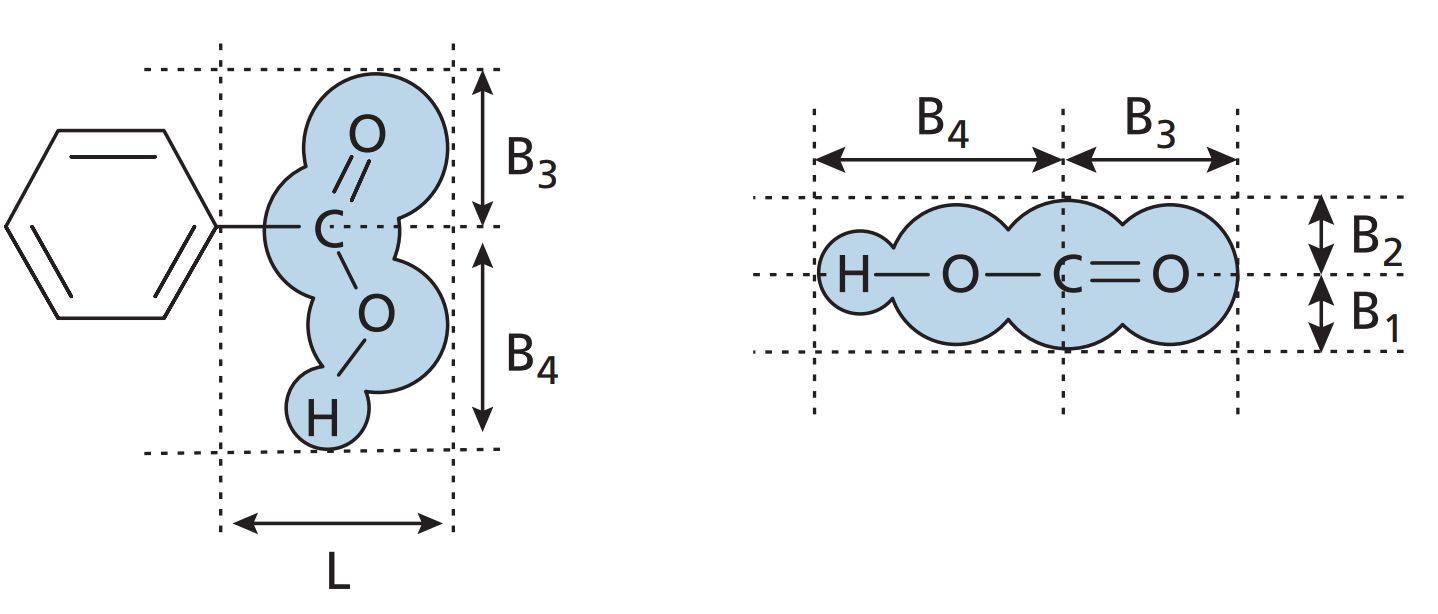
Verloop steric parameter
Another approach to measuring the steric factor involves a computer program called Sterimol, which calculates steric substituent values ( Verloop steric parameters ) from standard bond angles, van der Waals radii, bond lengths, and possible conformations for the substituent. Unlike Es , the Verloop steric parameters can be measured for any substituent. For example, the Verloop steric parameters for a carboxylic acid group are demonstrated in Figure. L is the length of the substituent and B1 –B4 are the radii of the group in different dimensions.
Other physicochemical parameters
The physicochemical properties most commonly studied by the QSAR approach have been described above, but other properties have been studied including dipole moments, hydrogen bonding, conformations, and interatomic distances. Diffi culties in quantifying these properties limit the use of these parameters, however. Several QSAR formulae have been developed based on the highest occupied and/or the lowest unoccupied molecular orbitals of the test compounds. The calculation of these orbitals can be carried out using semi-empirical quantum mechanical methods. Indicator variables for different substituents can also be used.
APPLICATIONS OF QSAR
Prediction of Biological activity-with regression analysis or parameters or their nature and position of substitution.
QSAR gives positive influence on the compound to be guessed.
Understanding the mechanism of action of a drug.
Optimisation of biological activity.
Lead compound search by CADD
Refinement of synthetic targets.
Economise the new drug development.
Reduction of usuage of animals.
Minimise random synthesis.
Introduction to drug design
Too many chemicals problem
Many chemicals to evaluate for multiple toxicity endpoints
More sensitive analytical chemistry methods for chemical identification
Lack of sufficient and relevant in vivo data
Alternative to animal testing
Broad applications as a faster and cheaper alternative to animal testing methods in academia, industry and government institutions
Regulatory uses
Supplement experimental data
Support prioritization in the absence of experimental data
Substitute or replace experimental animal testing methods
Rational chemical design
Design and development of new drugs, perfumes, dye etc. in an efficient manner
Promoting green chemistry
Design of chemical products and processes that reduce or eliminate the use/generation of hazardous substances.
Others Application
Chemical applications of QSAR
One of the first historical QSAR applications was to predict boiling points.
It is well known for instance that within a particular family of chemical compounds, especially of organic chemistry, that there are strong correlations between structure and observed properties. A simple example is the relationship between the number of carbons in alkanes and their boiling points. There is a clear trend in the increase of boiling point with an increase in the number carbons, and this serves as a means for predicting the boiling points of higher alkanes.
A still very interesting application is the Hammett equation, Taft equation and pKa prediction methods.
Biological applications of QSAR
The biological activity of molecules is usually measured in assays to establish the level of inhibition of particular signal transduction or metabolic pathways. Drug discovery often involves the use of QSAR to identify chemical structures that could have good inhibitory effects on specific targets and have low toxicity (non-specific activity). Of special interest is the prediction of partition coefficient log P, which is an important measure used in identifying "druglikeness" according to Lipinski's Rule of Five.
While many quantitative structure activity relationship analyses involve the interactions of a family of molecules with an enzyme or receptor binding site, QSAR can also be used to study the interactions between the structural domains of proteins. Protein-protein interactions can be quantitatively analyzed for structural variations resulted from site- directed mutagenesis.
It is part of the machine learning method to reduce the risk for a SAR paradox, especially taking into account that only a finite amount of data is available. In general, all QSAR problems can be divided into coding and learning.
For risk management
QSAR models have been used for risk management. QSARS are suggested by regulatory authorities; in the European Union, QSARS are suggested by the REACH regulation, where "REACH" abbreviates "Registration, Evaluation, Authorisation and Restriction of Chemicals". Regulatory application of QSAR methods. includes in silico toxicological assessment of genotoxic impurities. Commonly used QSAR assessment software such as DEREK or MCASE is used to genotoxicity of impurity according to ICH M7.
The chemical descriptor space whose convex hull is generated by a particular training set of chemicals is called the training set's applicability domain. Prediction of properties of novel chemicals that are located outside the applicability domain uses extrapolation, and so is less reliable (on average) than prediction within the applicability domain. The assessment of the reliability of QSAR predictions remains a research topic.
The QSAR equations can be used to predict biological activities of newer molecules before their synthesis.
QSAR has been applied extensively and successfully over several decades to find predictive. models for activity of bioactive agents. It has also been applied to areas related to discovery and subsequent development of bioactive agents: distinguishing drug-like from non-drug-like molecules,87 drug resistance,88 toxicity prediction,89-94 physicochemical properties prediction (eg water solubility, lipophilicity),95 gastrointestinal absorption,96 activity of peptides 97 data mining.98 drug metabolism,99 and prediction of other pharmacokinetic and ADME properties.100,101 Recent reviews 102-112 summarise work in a number of these areas and a book78 has summarised the application of neural networks to combinatorial discovery. The journal Quantitative Structure-Retivity Relationships contains abstracts of QSAR studies in other journals in each issue.
It is clear that the number of potential applications for structure property modelling, in the most general case, is extensive and growing daily. Improved molecular descriptors, based on a better understanding of which molecular attributes are most important for a given property being modelled, and increasing use of genetic and artificial intelligence methods will raise QSAR to even greater levels of usefulness than the current high level. A basic understanding of QSAR concepts is essential for most people. across a diverse range of skills, who design molecules.
In the field of drug designing
Information from the intercept values, Importance of log P concept,Bioisosterism, Enzyme Inhibition,Information on receptor site, Importance in Drug Research
References:
An Introduction to Medicinal Chemistry by Graham L. Patrick
"Structural biology and drug discovery" Miles Congreve,Christopher W.Murray and Tom L.Blundell, Volume 10, Number 13 July 2005
Bioorganic and Medicinal chemistry "Drug Guru: A computer software program for drug design using medicinal chemistry rules", Kent D. Stewart, Melisa Shirodaa and Craig A. James, 14, 7011-7022, 2010.
Drug Discovery Today "Shape Signatures: speeding up computer-aided drug discovery". Peter J. Meek et al., Volume 11. Numbers 19/20 October 2006.
Drug Discovery Today: Technologies," New technologies in computer-aided drug design: Toward target identification and new chemical entity discovery". Yun Tang, Weiliang Zhu, Kaixian Chen, Hualiang Jiang, Vol. 3, No. 3 2006.0
Wilson and Gisvold's textbook of pharmaceutical and medicinal chemistry.
Textbook of Medicinal chemistry by Ashutosh Kar.
A textbook of medicinal chemistry by Ilango..
Internet Sources: https://en.m.wikipedia.org/wiki/English_Wikipedia; https://www.britannica.com/; https://www.who.int/; www.sciencedirect.com;


Comments
Post a Comment